


Comprehensive Stock Research, Simplified
Putting on blush can have a huge effect on your overall look, and I personally never leave it out of my makeup routine. Blush is especially necessary if you’re wearing a foundation with more opaque coverage, which can sometimes leave your complexion looking a little bit flat.
Blush comes in powder, gel, and cream formulations, with powder being the most popular. Recently, though, cream and gel blush have become very popular as well.
We provide fundamental and technical research, IPO and mutual fund insights, and regular market updates to keep you informed and ahead.

Discovering high-potential small-cap stocks through in-depth research and analysis, aiming for substantial growth and exceptional returns.

Identifying undervalued stocks with strong growth potential using meticulous analysis and valuation techniques.

Targeting stocks with steady growth potential over several months to a few years through balanced analysis and market trend evaluation.

Conducting thorough evaluations of upcoming IPOs, including detailed assessments of company fundamentals, market potential, and risk factors to uncover promising investment opportunities.

In-depth evaluation of mutual funds to help you select the best options aligning with your goals and risk tolerance.

Providing detailed insights from on-site company visits, including firsthand observations and evaluations of operations, management, and growth prospects.

Summarizing key insights to capture management’s outlook, strategies, and financial highlights for informed investment decisions.

Short-term trading strategies designed to grow from quick price movements based on technical analysis and market sentiment.

Investing in stocks with strong short-term growth potential by leveraging technical analysis, market trends, and fundamental insights to maximize returns within a few months.

Delivering regular updates with comprehensive market analysis, investment tips, and the latest news to keep you informed and ahead in your investment journey.

Offering personalized portfolio analysis and tailored recommendations to optimize your investments, manage risks, and maximize returns.

Get comprehensive market analysis, investment tips, and the latest news in our regular webinars. Stay informed and ahead in your investment journey with expert insights and actionable advice.
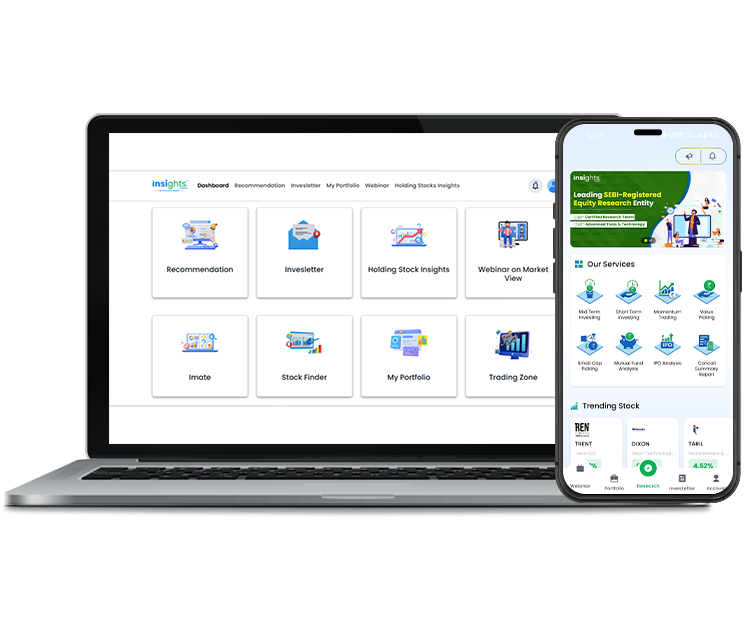
Discover powerful tools and in-depth analysis to stay ahead in the market. From stock screening to expert research and analysis, get the insights you need for smarter investing.
Gone are the days of hopping between different platforms to analyze a stock. Our easy-to-use, interactive interface gives you everything you need to know about a stock on a single page. From detailed financials to technical charts, it’s all here:
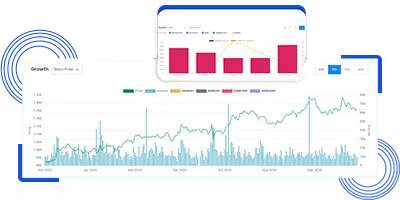
Understanding a company’s growth has never been this simple! Our Growth Chart gives you a clear view of key performance indicators, all in one place. Whether it’s price trends or financial growth, here’s what you get:
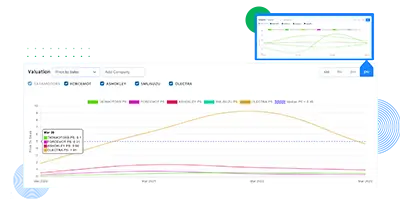
Make sense of a company’s valuation with ease using our Valuation Chart. It’s designed to give you a comprehensive view of how a company is priced relative to its fundamentals. Here’s what it includes:
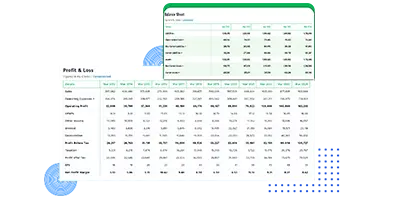
We’ve reimagined the way you view financial statements! Our Interactive Balance Sheet and Profit & Loss Statement is designed to make even complex financial data accessible to everyone, no finance background needed
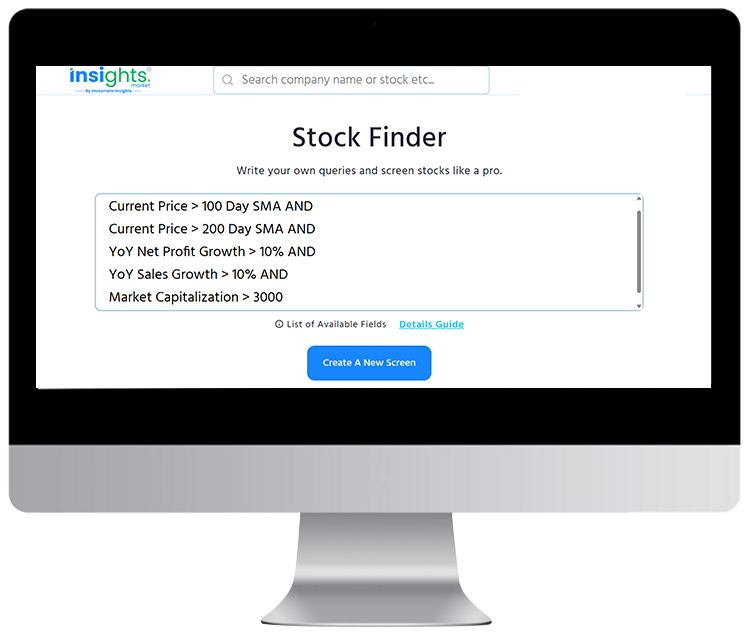
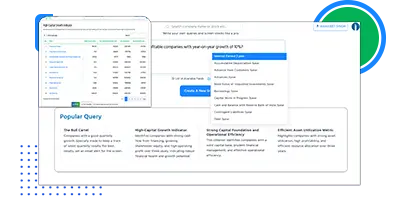
Our stock screener lets you filter stocks based on financial metrics without the need for complex coding or queries.
Our SEBI-licensed research service provides expert insights tailored to your investment needs. With a dedicated team of experienced research analysts, we ensure you make informed decisions.No matter your investment style, whether you're trading actively or focusing on long-term growth, we provide:
InvesLetter is a weekly newsletter designed to keep investors informed and empowered. We provide:


Interactive Dashboard enable the user to surf through performance of indices and stocks as per few criteria and custom time period.

User can setup a custom timeline based on the stocks on his radar and keep getting all kinds of updates related to those stocks.
The stock market, one of our country's most important economic pillars, allows investors to utilize their surplus money and earn a profit in return while helping companies raise funds for their growth.
If we dive deep into this huge ecosystem, we will see a structure similar to any other commercial marketplace where the buyers and sellers come together to trade their goods or products. The same thing happens in this case, but instead of any goods, in the stock market, mainly a company’s portion (share) gets traded.
There are more than two thousand big, medium, and small organizations listed in the Indian share market. But when it comes to finding good growth-making stocks to invest in, it becomes difficult to analyse all these companies and their insider details all at the same time.
Also, comparing all the data to draw any conclusion demands proper market knowledge and enough time. Here to save your time and help you effectively with the proper and actual market insights, Fundamental Stock Analysis Tools come in as a great help.
Whether it is trading or investing, 1. Finding 2. Comparing, and 3. Analyzing plays a great role in profit-making.
Fundamental & Technical—these are the two important analyzing processes that help you get the idea of the market, what is happening, how you should plan your action execution, etc.
For the time being, we’re talking about the fundamental analysis part, which is a very important segment for any trader or investor.
Whether you’re interested in a short-term swing or a long-term investment, fundamental analysis is the reality check for every market enthusiast that you should surely consider before making any decision.
Fundamental analysis helps investors understand a company’s true financial growth potential, valuation, product demand, etc. Fundamental analysis includes analyzing financial statements, management quality, industry trends, macroeconomic indicators, participants' sentiments, etc., and gives you a crystal-clear idea about which stocks to hold for the long run.
But not every fundamental research tool gets to the main point and delivers the exact information that is required to an investor. Below are some criteria the tool must follow to fulfill our requirements.
A professional research tool must offer easy access to a company's multiple years of historical data to spot trends quickly. It should accurately and automatically calculate the important financial ratios, like P/E ratio, ROE, debt-to-equity, etc., so that investors can get a quick overview of the company's financial health without wasting any time.
A good tool will allow you to compare the competitors side-by-side, along with industry benchmarks like the Nifty 50, to identify leaders and laggards within a sector.
Go for the tools that not only help with the data of the company you're putting in manually but also allow you to filter stocks based on your criteria, helping you narrow down your stock picks efficiently.
Last but not least, ensure the tool provides data from authentic sources and updates in real time.
Upon looking at the above-discussed features, INSIGHTS.MARKET, a perpetual equity research platform of SEBI-registered equity research entity INVESMATE INSIGHTS, can be your best choice as one of the effective fundamental stock analysis tools.
In this advanced technology world, Insights.Market assures you get the right and only what is needed information to make your investment portfolio grow strategically. Mainly Insights.Market provides research-based solutions to the investors, but our platform fosters all the necessary features that are required to make your analysis powerful without anyone's help.
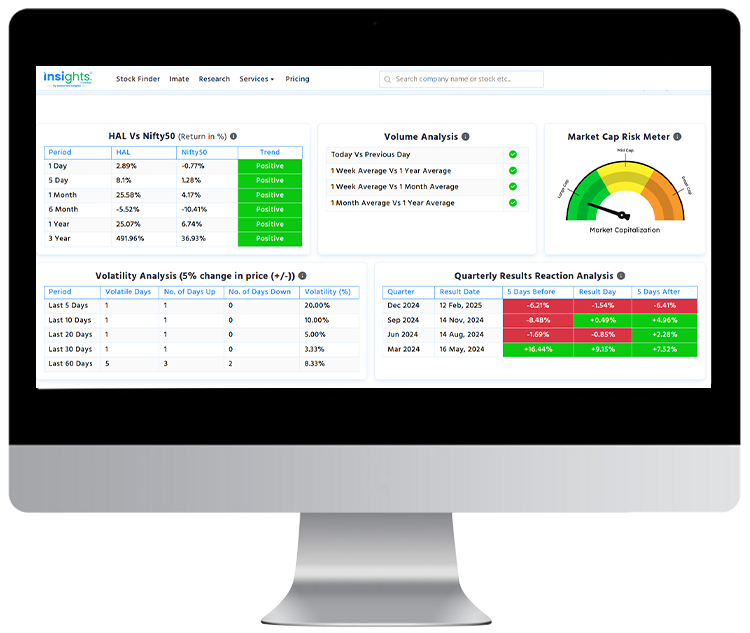
Where the feature like STOCK FINDER will help you filter out the stocks based on your requirement, our other feature, IMATE, provides essential technical and fundamental analysis factors in a simple yet powerful data visualization format.
Understanding a company’s true financial health starts with a deep balance sheet analysis. But as already said, it is not possible to manually scrutinize all the company's financial health. In this case, Insights Market, our share market data analysis tool, makes it simple and intuitive in just one click.
With our cutting-edge tool, investors can quickly access and interpret critical data points like: Assets and Liabilities Breakdown, Shareholder Equity Trends, Complete Balance sheet, Cashflow Statement, etc.
Also, Insights.market presents historical data and visual comparisons with simple, easy-to-follow command charts to help you spot financial strength, hidden risks, and changes in just a click. Whether you're looking for companies with strong cash reserves or low debt obligations, this tool makes informed investing easier than ever.
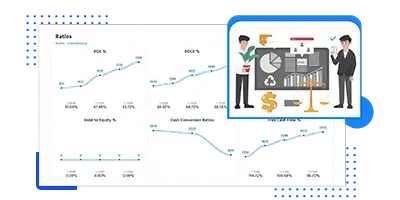
Every investor knows how important it is to focus on financial ratios for long-term investment. Ratios reveal the real story behind the numbers and our INSIGHTS.MARKET's Financial Ratio Analysis feature puts powerful insights at your fingertips.
With Insights.Market, you get ratios explained in simple terms, with benchmark comparisons and trend-tracking features, helping you understand if a stock is overvalued, underperforming, or ripe for investment.
Insights.Market is a tool developed for analyzing, scrutinizing, and filtering out Indian stocks or equity and to help all kinds of investors [short- to long-term]. But please remember that all the data published here is subject to change from time to time based on the companies' performances and updates. Take this tool only for your own education/research purposes. We strongly encourage you to conduct your own due diligence and ensure you are fully confident in your investment decisions before acting.
Technology simplifies the process, but your own intellect and judgment are what ultimately drive success.
A powerful fundamental analysis tool makes your research process easy and guides you to the stocks that are more likely to withstand market volatility and deliver sustained returns over time.
Unlike humans, these fundamental analysis tools reduce the risk of emotional or hype-based decisions, allowing for a disciplined and data-driven investment strategy.
There are multiple tools that provide the best screening plus analyzing features for investors. Choose what suits your criteria. Insights.Market can be a great help in this.
Technically, yes. You can analyze company data directly from annual reports, balance sheets, and regulatory filings. However, tools simplify the process by organizing and visualizing data, saving time and effort.
It depends on your goal. Fundamental analysis is ideal for long-term investing, while technical analysis suits short-term trading. Insights.Market has both features for all ranges of stock market investors/traders.
The important ratios that help evaluate a company’s profitability, financial health, and growth potential.
1. P/E Ratio (Price to Earnings)
2. ROE (Return on Equity)
3. Debt-to-Equity Ratio
4. Current Ratio
5. Free Cash Flow
Absolutely. Because of our interactive and seamless interface, any beginner can access Insights.Market easily. Besides that, we provide tutorials and a few effective built-in stock filters that help new investors get started with confidence.
 Copyright © 2025 All rights reserved with INVESMATE INSIGHTS PRIVATE LIMITED
| All logos and Trademarks registered with their respective owners.
Copyright © 2025 All rights reserved with INVESMATE INSIGHTS PRIVATE LIMITED
| All logos and Trademarks registered with their respective owners.